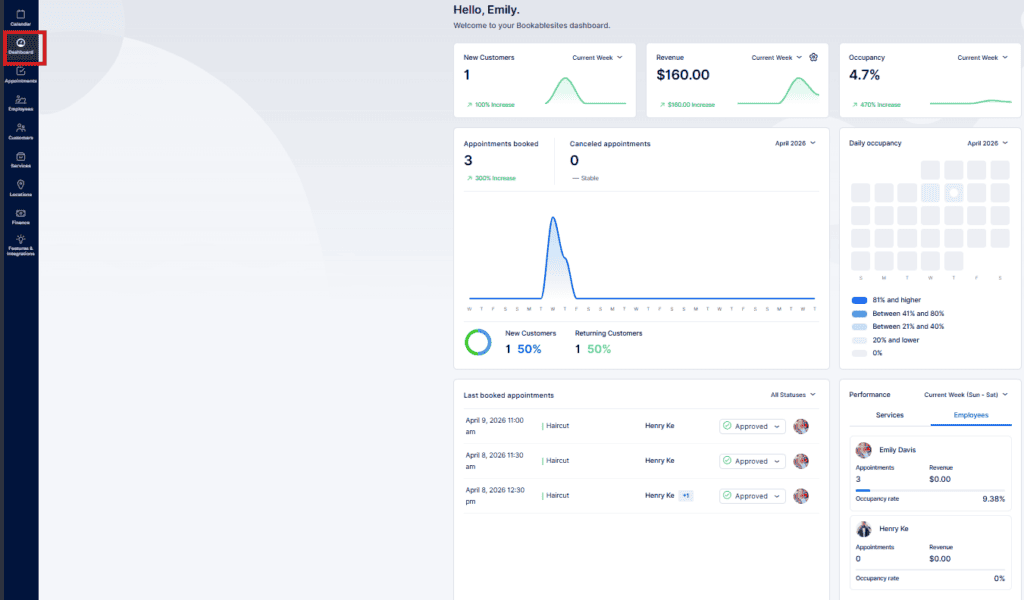
When you sign in to Bookablesites with an Admin account, you are taken to the Dashboard. This page offers a consolidated view of upcoming and past appointments, staff details, revenue figures, and a summary of services — all in one place.
The dashboard is divided into seven primary sections, each providing specific data and insights.
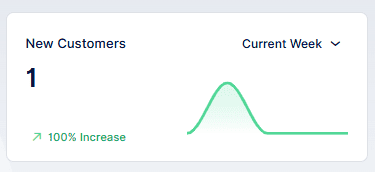
New Customers
The “New customers” panel displays the number of clients who made their first booking during the time range chosen in the period picker. Available ranges include Current week, Last week, This month, Last month, Last three months, Last six months, Last twelve months, and Last year. A chart is also provided to visualize how new customer counts have changed over the selected period in Bookablesites.
Revenue
The Revenue panel shows the total income generated during the period selected in the period picker. Using the gear icon, you can toggle the display to show totals for paid transactions, pending payments, or a combined sum. A chart also plots revenue trends across the chosen timeframe in Bookablesites.

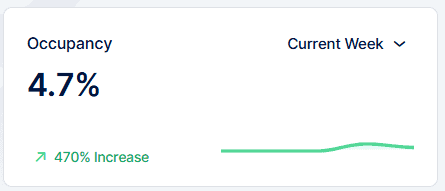
Occupancy
The Occupancy panel displays the occupancy rate, calculated by comparing each employee’s booked appointment hours to their total available working hours. You can choose the timeframe to analyze and view a corresponding chart that illustrates occupancy trends for the selected period in Bookablesites.
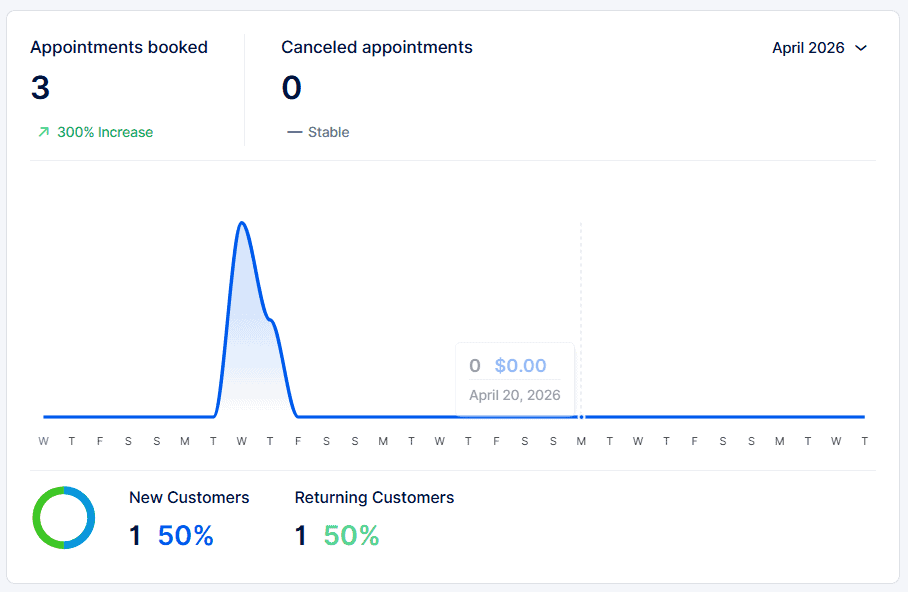
Appointments overview
The Appointments panel lets you track booking volume for either the current year or since your account creation in Bookablesites. It shows the total appointments and indicates the percentage change (positive in green, negative in red) versus the prior period. The panel also reports cancellation statistics. Beneath the chart, user metrics are displayed — the number and share of new users versus returning users who made bookings during the selected timeframe.
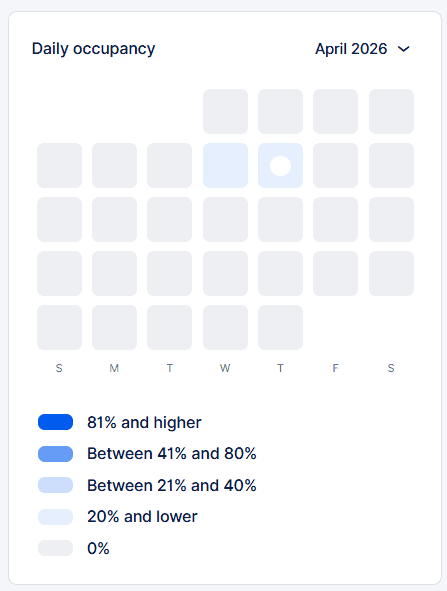
Daily occupancy
The Daily Occupancy panel displays the utilization rate for each day of the month. Like the overall occupancy metric, it’s calculated by dividing total appointment hours by the combined working hours of all employees for that day. Different occupancy bands are shown using varying color shades, with a legend indicating which shade maps to which percentage range. Clicking a specific day reveals the exact occupancy percentage for that date in Bookablesites.
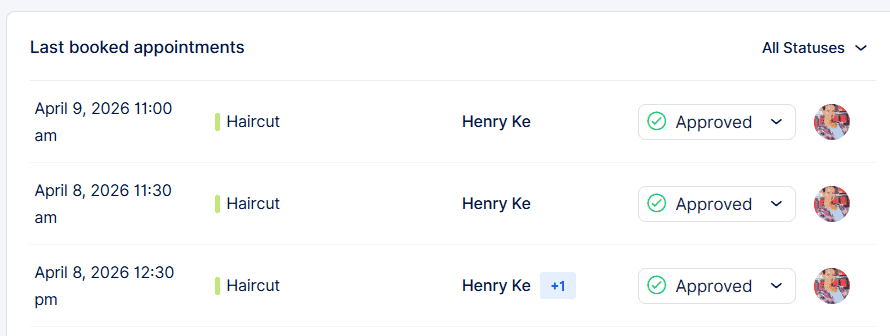
Last Booked Appointments
The Last Booked Appointments panel provides a chronological list of recent bookings, showing key information for each entry—date and time, service, assigned employee, and customer. The newest bookings appear first, with older ones following. Use the status filter to display only Approved, Pending, Canceled, Rejected, No-show, or All appointments within Bookablesites.
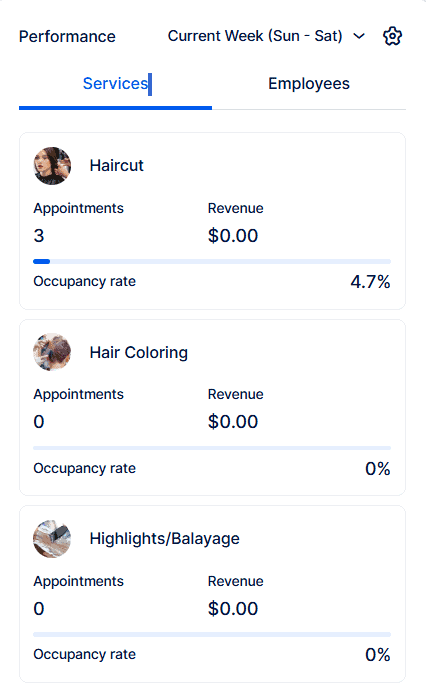
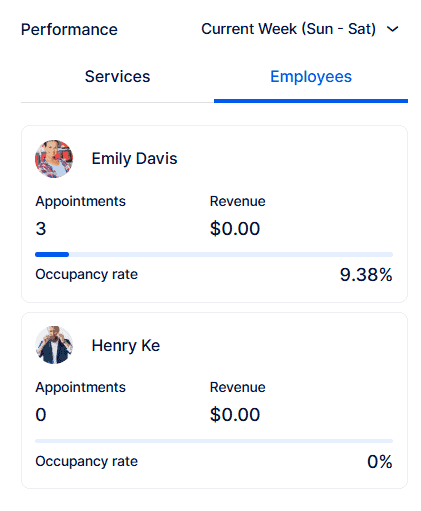
Performance
The Performance area includes two tabs — Employees and Services — each highlighting the top three entries by occupancy based on your chosen sort order (highest or lowest). For every listed employee or service you’ll see their occupancy percentage, total appointments, and revenue for the timeframe selected in the period picker at the top right of the section in Bookablesites.